20061212
.: Jonas 10:00 PM
FINAL REVIEW
Tuesday 12/12 at 1pm, Upper Gallery
JURY
Gisela Baurmann
Galia Solomonoff
Detlef Mertins
Carles Vallhonrat
Jason Vigneri-Beane
Erich Schoenenberger
Rhett Russo
Print:
- Site analysis
- Mesh matrix
- Study selected mesh
- Site Plan 1/16"
- Plans + Sections 1/8"
- Species diagram processed
- Program diagram
- System Study Rhino, component aggregation
- System Study Rhino, building envelope
- 3d Rendering
Model:
- Site-Structure models, selection
- Site model at 1/16"
- Endemic House model 1/4", including adjacent grade
- Unit System, genealogy and assembly
- Unit genealogy Project 2, relevant selection
- System model at 1", aggregation as partial building system
Contribute to Gene Pool, coordinate with Jon
Submit complete documentation Project 1-3 on CD Rom
Blog Best of Project 1-3
.: Jonas 1:00 PM
20061202
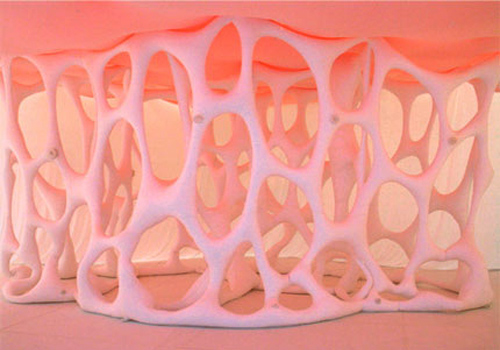
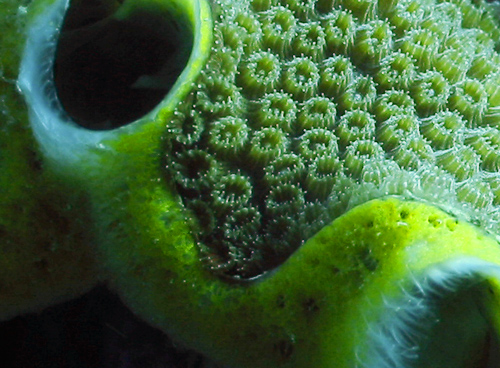
Ernesto Neto
.: Jonas 10:18 AM
20061030
WEEK NINE
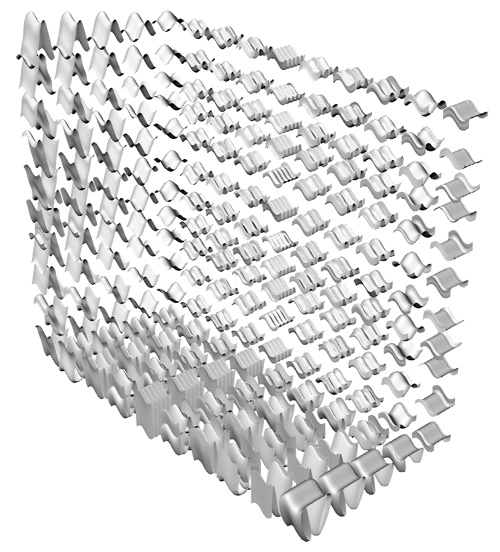
Endemic House // Testing Ground
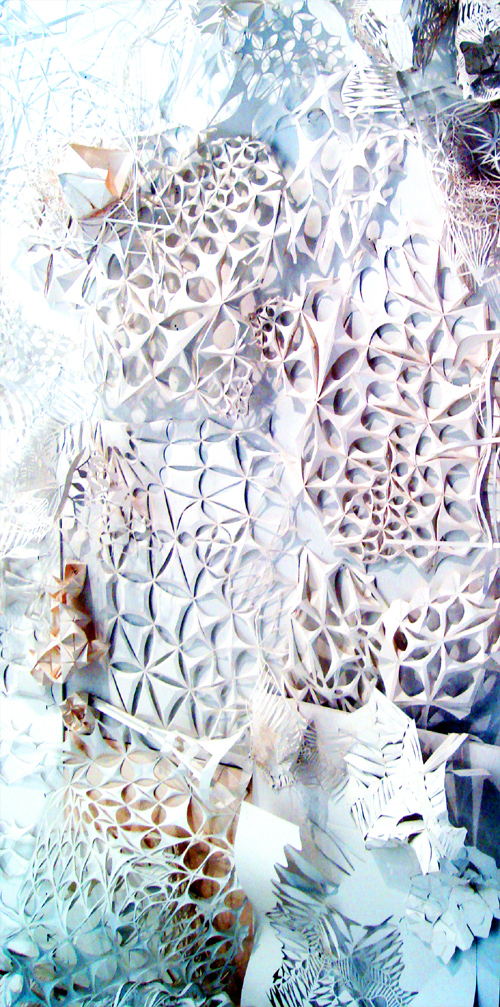
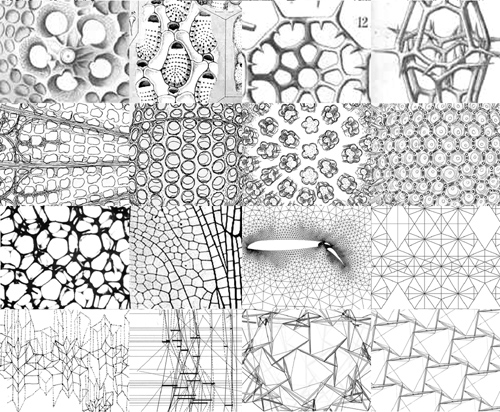
Two sheets of paper are scored to reveal a site specific mesh. A set of rules determines which score lines are cut and which edges are attached to generate continuity between the two surfaces. The emerging model addresses the fundamental question of site-structure (ground to building) relation in a speculative way. The Endemic House and its site are two expressions of the same System: none is a given; each is the continuation of the other.
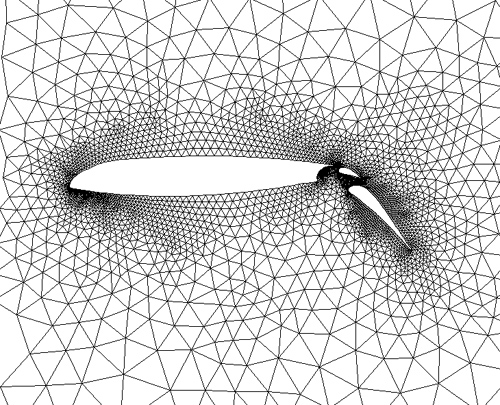
A Voronoi diagram is derived from the triangulated mesh. [Each point of the mesh generates a convex polygon and every point in that polygon is closer to the generating point than to any other. = definition Voronoi] Together, the triangulated mesh and the Voronoi diagram form a dual Testing Ground for the System. Both renditions of the Testing Ground consist of cells, either triangles or polygons.
The Testing Ground lays out geometric requirements for the System, which is continuously adjusted and improved. In the process the system might be simplified, in some cases radically changed. In all cases the System grows to be more responsive and fit to perform on the Testing Ground. After a preliminary round of tuning, one of the Testing Grounds - triangulated mesh or Voronoi - is selected as it informs the system most immediately.
Simple Ground Rules define how the System components (units) adjust to the cells of the Testing Ground. Each cell either changes in scale and angle (Mesh triangles), or it changes in number of points, scale and angle (Voronoi polygons). These parameters define the System's spectrum of change, from the local unit upward (neighboring conditions, global behavior).
The Ground Rules control - among others - how a cell (flat) changes a unit (spatial) in all three axes. The cell might reside in the unit - as its plan for example - or it guides the change of the unit, in which case a simple algorithm is in place to define the relation.
The ground rules are developed in simple line drawings and simple mathematical functions, and they are immediately tested 'on the ground' (paper on paper). The emerging System is a fully integrated building system of the Endemic House. It is site and load bearing structure, skin and space-defining building envelope. At times the system shows only a simple expression; at others it reveals its full intelligence.
Start with a few simplified paper units as they negotiate the cellular change. Define three different Ground Rules and apply each to a copy of to the same Testing Ground.
due on Wednesday:
- Selected mesh and corresponding Voronoi diagram
- 3 variations Ground Rules, text and line dwg
- 3 paper models, aggregates of 5-10 units each
Voronoi applet
.: Jonas 2:00 PM
20061023
Endemic House // Preliminary Site Study
Let us go back to the map and the territory and ask: "What is it in the territory that gets onto the map?" We know the territory does not get onto the map. That is the central point about which we all are agreed. Now, if the territory were uniform, nothing would get onto the map except its boundaries, which are the points at which it ceases to be uniform against some larger matrix. What gets onto the map, in fact, is difference, be it a difference of altitude, a difference of vegetation, a difference in population structure, difference of surface, or whatever. Differences are the things that get onto the map. A difference, then, is an abstract matter - Gregory Bateson, Steps to an Ecology of Mind
1) Generate 3-15 nurb curves in a simple 2D Rhino drawing. The curves are derived from the site information you can gather by Tuesday 10/24 midday. The site is defined as the small tidal basin located at the southeast corner of the Baquenzo Moreno Port. The curves may be informed by general site boundaries (canal, boardwalk, airport), topographic information - any qualitative change you deem important (see quote above); together they express the most poignant features of the site. Focus on the location and sequence of the control points that describe the curves; the curves themselves do not have to match any given site line.
2) Use 'Loft' and 'NetworkSrf' to generate several versions of a simple (and flat) nurb surface. Try different settings in the surface tool options to create finer variations.
3) Create a 'Mesh' from the surface. Use 'Simple controls' (density of mesh) and 'detailed controls' (min. max. edge length et al.) to generate different densities and grain.
4) 'TriangulateMesh'
5) Generate a comprehensive series of meshes, then feed a tight selection to the laser cutter. The edges of the triangles are all scored, not cut by the laser. Use water color paper or 1 ply chipboard ( 12" x 12" ) to score the triangulated mesh surfaces. Laser two copies of each version.
Set up a Mesh Matrix with the generating nurb curves in one dimension (x) and the tessellation parameters in the other (y). The cells of your matrix (xy) contain phenotypical expressions in the form of cropped polygonal fields (line dwgs).
While the parameters (y) merely record the change in Rhino tool options; the curve 'discussion' (x) describes the curves 'content' and its formal behavior. Since a curve's control points mark a given site line, the formal characteristic of the curve is an expression of the found territorial difference. Group the curves according to content (boundary, infrastructure, topography) then use transitive verbs to describe behavioral attributes of the curve and the relations within the group (aggregate, bifurcate, compress, connect, dent, deviate, dislocate, double, expand, isolate, loop, protrude, relax, stretch, swerve). Print out on 11"x17".
Mesh Matrix content:
X - Curve Group (noun), Curve Behavior (verb) [type, arial 12pt]
Y - Tool, Tool Option, Numerical Value [type, arial 12pt]
XY - Mesh [line dwg]
Bring Thursday:
- Scored sheets, 3+ pairs 12"x12"
- Mesh Matrix, b/w print 11"x17"
- Sketches, Galapagos structures

Fineness
.: Jonas 9:00 PM
WEEK EIGHT
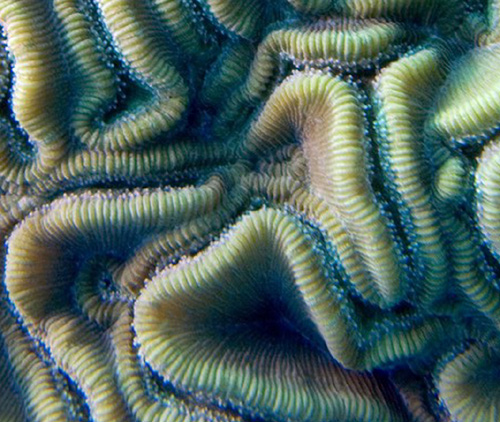
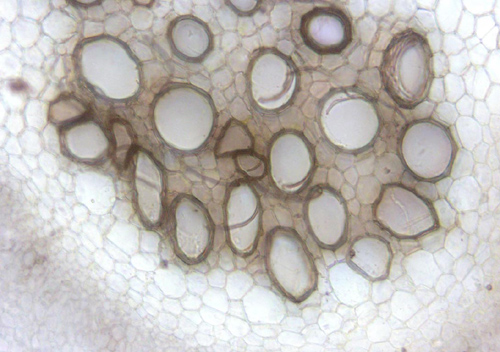
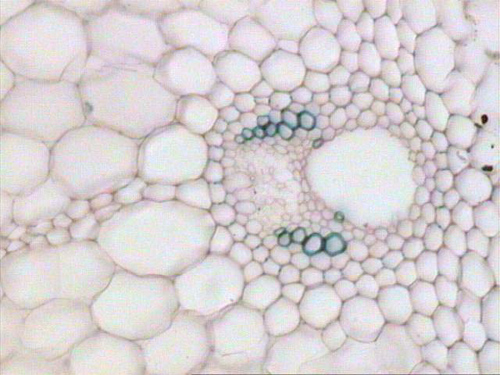
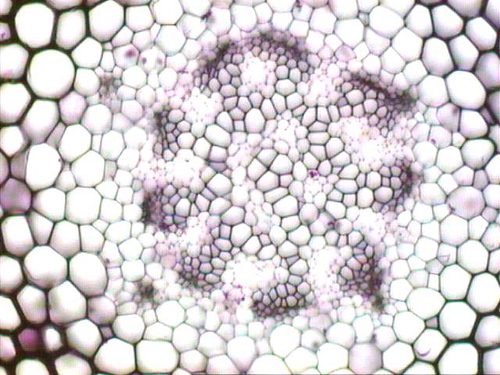
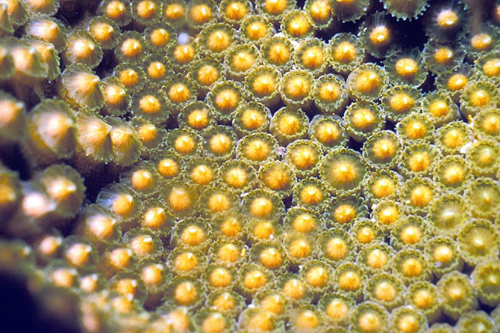
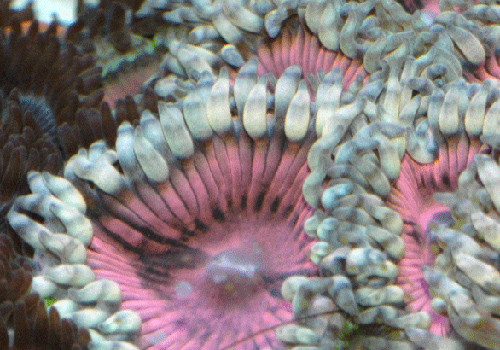
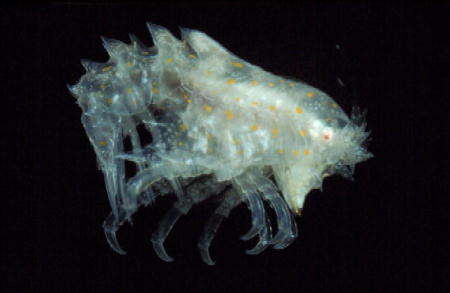
Endemic House // Resources
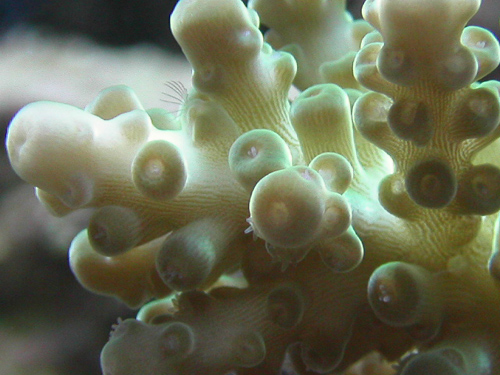
Created from a volcanic hot spot located on the ocean floor, the Galapagos are oceanic islands which have never been connected to a continent. All of the organisms found in the Galapagos arrived in the islands by swimming, flying or floating. [..]
Species had 3 methods of arrival in the islands, marine life including whales, dolphins, fish, seals and penguins arrived by swimming along with the currents. Birds arrived by flying as did many seeds, mosses orchids and ferns, which arrived by air currents rather than actual flight. Other species like tortoises, iguanas, trees, insects, and some seeds arrived by floating either due to a built-in air chamber or by floating on trees and other plants.
Once these species arrived the islands became populated with an unbalanced collection of species; the presence of reptiles but no amphibians, numerous birds but few mammals, grasses and ferns but hardly any plants with large flowers or heavy seeds. [..]
Many species found it necessary to adapt to the environment in order to survive. As the years progressed and adaptations occurred new species and subspecies began to populate the islands. The lack of natural predators allowed many species to flourish and eventually give the Galapagos their unique make up.
Galapagos Info
501 Project Three
Species and Ecosystems
Endemic defined
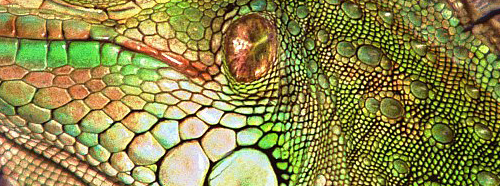
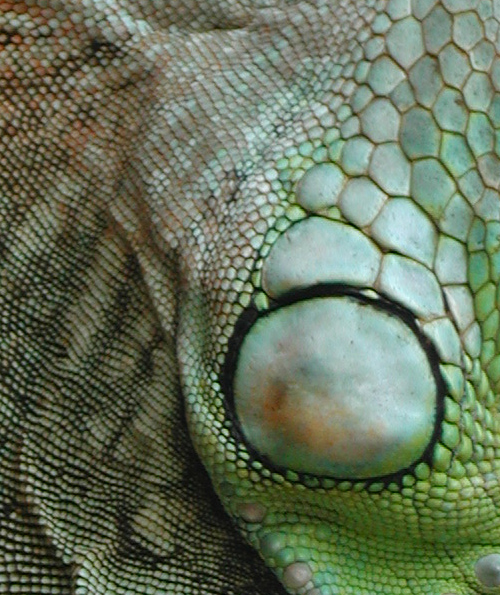
Lizard show
Galapagos film
.: Jonas 8:00 PM
FINAL REVIEW PROJECT TWO
Jury: Jason Lee, Babak Bryan
Upper Gallery (right) 1pm
MODELS
- Detail section model or partial model at 1/2" = 1'-0"
- Genealogy Foam
- Genealogy Paper
- Assembly Diagram Foam
- Assembly Diagram Paper
- Continuous Tectonic Field model Foam
- Continuous Tectonic Field model Paper
PRINT
- Plan of the System on Site 1/4" = 1'-0" (*)
- Longitudinal and Cross Section 1/4" = 1'-0" (*)
- Best of Re-writing Collages
- Math Cloud of finer Parametric Variation
- Global Script (**)
- Species Diagram Artifacts (***)
- System model Rhino, ortho views wireframe and perspective shaded
all paper 36" high
all font Arial 16 pt. (body: regular, titles: bold)
all drawings black lines on white, shade renderings greyscale
green and lime (see foam) are the only colors allowed for accentuation
(*) Scaled line drawings (using line type and -weight) answer specific questions about the architectural intervention. What is the relation between the existing building structure and the structure of the new system. How does your component system negotiate the dimensionality of the stone wall. Does one grow out of the other? What is the relation between the new structure and the human figure. How do visitors circulate (dotted line for path). How are the items distributed/clustered throughout the exhibition space. How does the new system respond to the building. How how does the system respond to the items; does it stage, frame, display, hold, integrate, celebrate or merge into them. How do the system components display the artifact spatially (close by or far away) Is there a secondary expression of the system to secure the items. How do secondary expressions establish a structural hierarchy within the system?
(**) What is the set of instructions that generates your System. What are the local rules (math script, axiom, mapping rules), what are the rules for the system's growth and response on the site, and how are they guided by meta rules. What is the recipe, how can I build your system. What are the operative terms and spatial effects ?
(***) How are the artifacts related, what is their kinship? According to the specific classifications of your collection, what is the nodal network that organizes the multiple kinds of relations (topological, relation to body, manufacturing) within the larger family?
.: Jonas 2:00 PM
20061016
Dim i, j, m, pointArr, arrParam, uArr, vArr, arrDomV, arrPoint
Dim surface : surface = Rhino.GetObject( "Select a surface" )
Dim U : U = Rhino.getinteger( "How Many Points in U Direction?", 5 )
Dim V : V = Rhino.getinteger( "How Many Points in V Direction?", 5 )
'Rhino.EnableRedraw vbFalse
Call Rhino.unselectallobjects( )
Call Rhino.selectobject( surface )
Call Rhino.command( "-_reparameterize 0 1 0 1" )
Rhino.AddLayer "Points", RGB(0, 255, 255)
CheckLayer("Points")
Rhino.Print ("Calculating Points - Please Be Patient . . .")
For m = 0 To U - 1
uArr = m / ( U - 1 )
For j = 0 To V
vArr = j / V
ReDim Preserve newpoint(j)
newpoint(j) = Rhino.EvaluateSurface(surface,Array(uArr, vArr))
arrpoint = Rhino.AddPoint (newpoint(j))
Next
ReDim Preserve fullpointarray(m)
fullpointarray(m) = newpoint
Next
'Rhino.EnableRedraw vbTrue
Rhino.Print ("Finished with " & CStr(U * V + U) & " Points")
arrNumb = (U * V + U)
Dim arrNumb, iStart, iFinish, iStep
Dim IterationLayer, LayerCount
Dim moveaxis, arrmovenum, arrmoveinc, moveob
iStart = Rhino.GetReal ("Start Value?", 1)
iFinish = Rhino.GetReal ("End Value?", 5)
iStep = (iFinish / arrNumb)
LayerCount = 0
j = 0
m = 0
For i = iStart To iFinish Step iStep
LayerCount = LayerCount + 1
Rhino.AddLayer "IterationLayer " & CStr(LayerCount), RGB(255, 0, 0)
CheckLayer("IterationLayer " & CStr(LayerCount))
Rhino.command "mathsurface", i
moveob = ObjectsByLayer ("IterationLayer " & CStr(LayerCount))
Rhino.MoveObject moveob(0), Array(0,0,0), fullpointarray(j)(m)
m = m + 1
If m > U Then
j = j + 1
m = 0
End If
Next
Rhino.Print("Increment Count is " & CStr(iStep))
''''''''''''''''''''''''''''''''''''''''''''''''''''''''''
Function CheckLayer(layername)
If Rhino.IsLayer(layername) Then
Rhino.CurrentLayer(layername)
Else
Rhino.AddLayer(layername)
Rhino.CurrentLayer(layername)
End If
End Function
.: Jon 12:08 PM
20061015
.: Jonas 10:17 AM
20061013
Pin Up Monday
[System on Site]
- Global Script
- Model 1/2" = 1'-0"
- Plan 1/4" = 1'-0"
- Section 1/4" = 1'-0"
.: Jonas 9:00 AM
20061012
Midreview Thursday : Juror Ferda Kolatan
.: Jonas 9:17 PM
20061002
WEEK FIVE
When search spaces (or "adaptive landscapes") were first postulated in biology in the 1930s, they were thought to be prestructured by a single equilibrium, a kind of mountain with one peak, which selection pressures forced the probe head to climb. According to this schema, the top of the mountain represented the point of maximum fitness, and once a population had been driven there, selection pressures would keep it locked into this optimal equilibrium. However, recent explorations of adaptive landscapes, using sophisticated computer simulations, have revealed that these search spaces are anything but simple, that they may comprise many mountains of different heights (local optma), clustered in a variety of ways, the valleys and peaks related not directly to fitness but underlying dynamical stable states. - Manuel De Landa
Probe
Probe the space of Math variation. Dive into the studio pool of 33,000 surfaces (generated from 11 default surfaces) and grab three that reveal similarities to the spatial moments that you have identified and built previously. Start re-running the respective parametric changes in smaller increments to grow three clouds of finer variation. (math models)
Digitize
Digitize your physical models. Numerically define points in x-y-z space; high points, turning points, control points, end points. Unwrap, unfold your foamy and paper models to measure and record dimensions. In Rhino build Nurb surface models derived from your foamy models and Polygonal models from your paper models. Operate economically with control points and polygons. (manual models)
Exchange
Nurture an intensive exchange between math models, manual models and physical models. Example: Derive surface curves from a math model, manipulate the curves and generate a next generation manual model. Unfold the manual model, print the wire frame planar and prepare sheet material accordingly, then build a next generation physical model. Fine tune parametric variation of math model to approximate physical model. Record your steps.
Grow
Based on the continuous interlocking field study (foam, paper, pixel pattern) develop a combinatory logic and grow tectonic fields for the rhino and physical models. Probe and learn from different arraying techniques (along line, along surface). Focus on your cells' continuous variation. Parametric variation across the field generates change beyond a mere scalar shifts. Build the field testing boundary conditions and extreme values. Draw the field. Write the script.
Exhibit
Develop a concept for displaying the artifacts. The tectonic field can stage, frame or integrate the items; it could merge into the objects at certain moments, wrap around them or remain at a safe distance to them. You could eliminate the artifacts altogether - an extreme position - if the structure itself best celebrates or informs about the artifacts. Every approach to exhibiting the artifacts will invite a set of demands into your structure. Draw a catalog of responses.
Read
Manuel De Landa : Species and Ecosystems
.: Jonas 4:00 PM
20060929
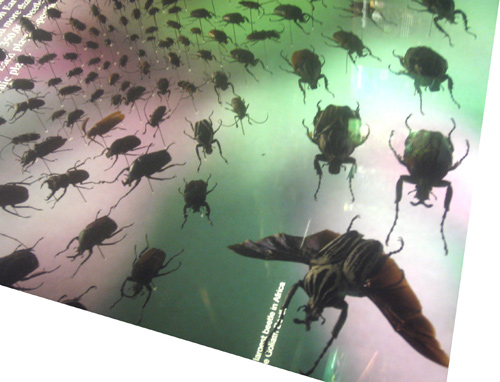
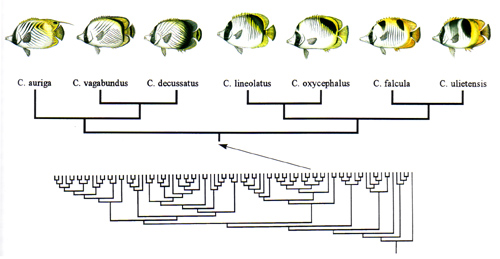
Species Diagram (Bronx Zoo)

Dim i
Dim arrNumb, iStart, iFinish, iStep
Dim IterationLayer, LayerCount
Dim moveaxis, arrmovenum, arrmoveinc, moveob
arrNumb = Rhino.GetInteger ("Number of Iterations", 10)
iStart = Rhino.GetReal ("Start Value?", 1)
iFinish = Rhino.GetReal ("End Value?", 10)
moveaxis = Rhino.GetString ("Axis to move objects? (click on option)", "x", Array("x" , "y" , "z"))
arrmoveinc = Rhino.GetReal ("Units to move objects", 20)
iStep = (iFinish / arrNumb)
LayerCount = 0
arrmovenum = 0
For i = iStart To iFinish Step iStep
LayerCount = LayerCount + 1
Rhino.AddLayer "IterationLayer " & CStr(LayerCount), RGB(255, 0, 0)
CheckLayer("IterationLayer " & CStr(LayerCount))
Rhino.command "mathsurface", i
moveob = ObjectsByLayer ("IterationLayer " & CStr(LayerCount))
'Rhino.Print(CStr(moveob(0)))
If moveaxis = "x" Then
Rhino.MoveObject moveob(0), Array(0,0,0), Array(arrmovenum,0,0)
Else If moveaxis = "y" Then
Rhino.MoveObject moveob(0), Array(0,0,0), Array(0,arrmovenum,0)
Else If moveaxis = "z" Then
Rhino.MoveObject moveob(0), Array(0,0,0), Array(0,0,arrmovenum)
End If
End If
End If
arrmovenum = arrmovenum + arrmoveinc
Next
Rhino.Print("Increment Count is " & CStr(iStep))
''''''''''''''''''''''''''''''''''''''''''''''''''''''''''''''''''''''''''''''''''''''''''''''''''''''''''''''''''
Function CheckLayer(layername)
If Rhino.IsLayer(layername) Then
Rhino.CurrentLayer(layername)
Else
Rhino.AddLayer(layername)
Rhino.CurrentLayer(layername)
End If
End Function
.: Jonas 8:01 PM
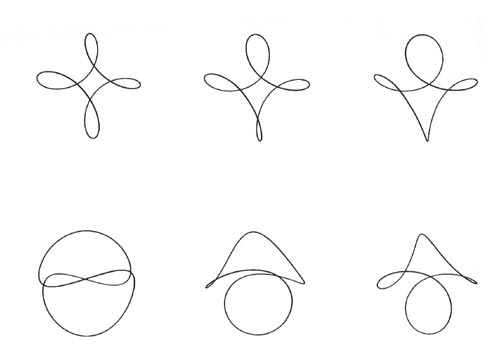
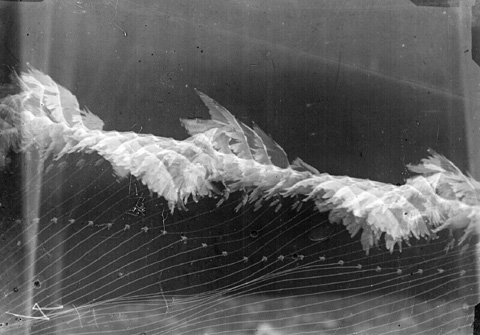
Movement Notation

World Championship of Fencing in Turin, 2006
see also 1 2 3
.: Jonas 10:26 AM
20060928
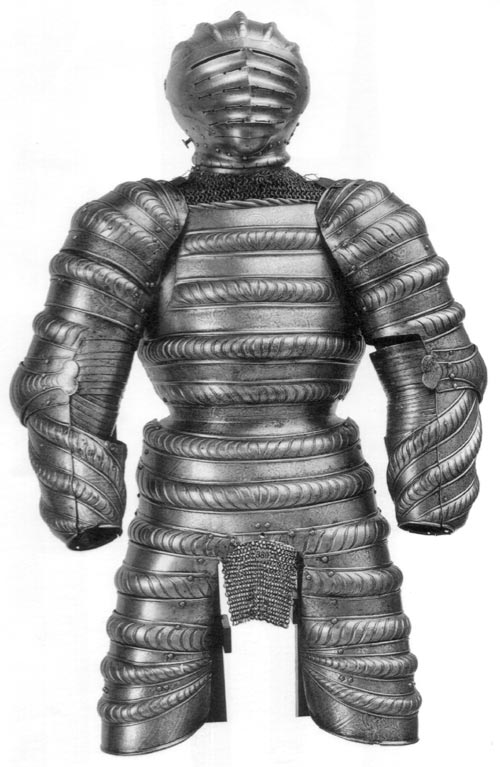
On your way to the Armory
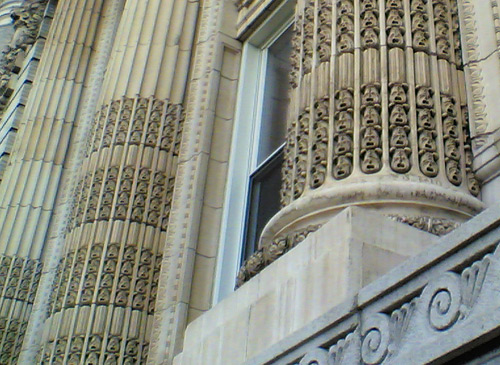
Armory

.: Jonas 11:54 AM
20060925
WEEK FOUR
The Movements - of crowds, dancers, fighters - recall the inevitable intrusion of bodies into architectural spaces, the intrusion of one order into another. The need to record accurately such confrontations, without falling into functionalist formulas suggested precise forms of movement notation. An extension of the drawn conventions or choreography, this notation attempts to eliminate the preconceived meaning given to particular actions in order to concentrate on their spatial effects: the movement of bodies in space. Rather than merely indicating directional arrows on a neutral surface, the logic of movement notation ultimately suggests real corridors of space, as if the dancer has been carving space out of a pliable substance’: or the reverse, shaping continuous volumes, as if a whole movement has been literally solidified, 'frozen' into a permanent and massive vector. - Bernard Tschumi, The Manhattan Transcripts
Build
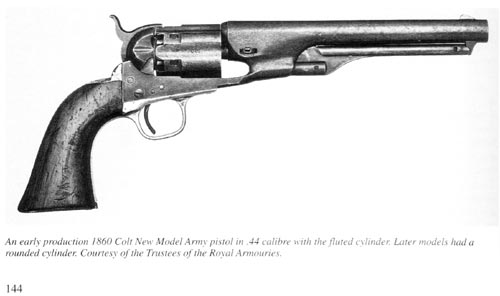
Build the three moments of topological kinship that have been isolated in the previous assignment (B). Build from sheets of foam and in full scale relative to the Civil War equipment they are derived from. Articulate topological qualities and exaggerate spatial effects. Use both shades of green within each model to accentuate surface behavior. Pinch, bend, twist, fold, wrinkle the material; cut and glue very deliberately/cautiously. Use T-pins to lock in position, super glue few points only.
Generate a word list with operative terms and corresponding spatial effects, and parallel it with a built Assembly Diagram, 3-5 steps mounted on white background starting with the manipulated (cut, marked(!)) sheet.
Cut crease fold and glue a simplified paper version of each model. Use white heavy paper. Unfold the unit and study the manipulated sheet. Build an assembly diagram, how does it differ from its foam sibling?
Select a meaningful pattern from the previous assignment (B) and build the continuous interlocking field from either the foam or paper unit(s). Test gradual variation within the field, exaggerate.
Draw
Extend the family of artifacts and discover additional spatial effect. Consider a second, maybe third branch of different topological kinship, considering different scales. Invent a taxonomy for your collection of 16 items. Organize the artifacts, put them in relation and draw a Species Diagram.
The species diagram may or may not be based on the items’ actual evolution and their relation in design/ manufacturing history, but it considers their relation to the body, movement in space and topological identity. The Species Diagram is a structured nodal network that consists of simple drawings of the items, movement notations and linear vectors of connection. The visualized taxonomy is not limited to a tree formation. Logic of self-replication and similarity to re-writing patterns might emerge.
Calculate
Grow the Math Matrix of Parametric Variation. Probe the expanding Space of Possible Variation.
.: Jonas 6:55 PM
Probe Space
.: Jonas 6:00 PM
Dim i
Dim arrNumb, iStart, iFinish, iStep
Dim IterationLayer, LayerCount
arrNumb = Rhino.GetInteger ("Number of Iterations", 10)
iStart = Rhino.GetReal ("Start Value?", 1)
iFinish = Rhino.GetReal ("End Value?", 25)
iStep = (iFinish / arrNumb)
LayerCount = 0
For i = iStart To iFinish Step iStep
LayerCount = LayerCount + 1
Rhino.AddLayer "IterationLayer " & CStr(LayerCount), RGB(255, 0, 0)
CheckLayer("IterationLayer " & CStr(LayerCount))
Rhino.command "mathsurface", i
Next
Rhino.Print("Increment Count is " & CStr(iStep))
''''''''''''''''''''''''''''''''''''''''''''''''''''''''''''''''''''''''''''''''''''''''''''''''''''''''''''''''''
Function CheckLayer(layername)
If Rhino.IsLayer(layername) Then
Rhino.CurrentLayer(layername)
Else
Rhino.AddLayer(layername)
Rhino.CurrentLayer(layername)
End If
End Function
.: Jonas 2:10 PM
20060921
WEEK THREE
A
Math_1: Load Parametric Seed Data
From the MathSurface library select one Geometric Primitive (Wave, Sphere, Torus, Moebius Strip, Stereographic Sphere, Eliptic Paraboloid, Catenoid Helicoid, Klein Surface, Enneper 2, Enneper 3, Enneper 4)
Math_2: Set up Matrix of Parametric Variation
Starting from the default setting, incrementally and systematically change the surface parameters, assigning one coordinate of change to one axis. The changing surface leaves a 3-dimensional trace of variation. Create as many fields as you need to exhaust all substantial variations while staying within the family of the seed surface. Consider the sequence of fields as the 4th dimension in your investigation.
Math_3: Probe the Space of Possible Variation
Navigate the fields of variation you have generated and select twelve distinctly different surfaces to be assembled in your new MathSurface library. Use the 'save math object data' function to store the parametric data and a preview image of the selected surface. Establish a naming convention starting with the seed as a domain.
B
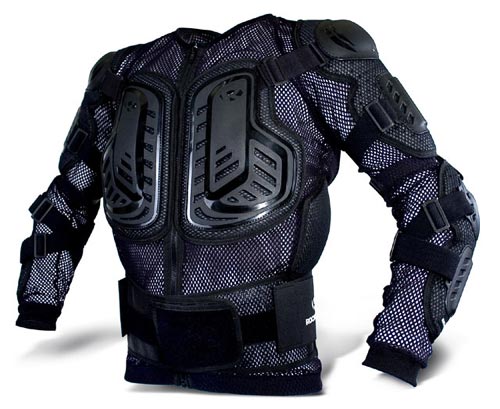
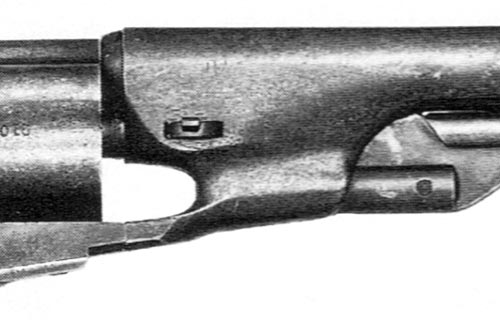
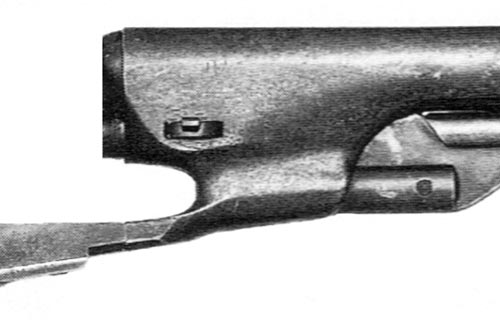
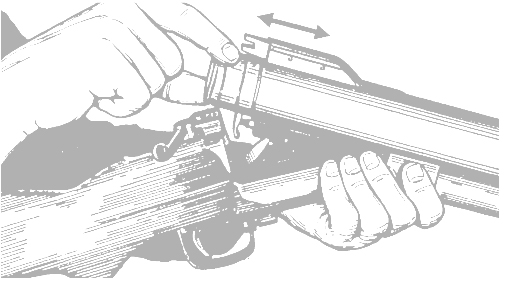
Duel_1: Explore spatial effects and topological qualities of Civil War equipment.
From a catalogue of Civil War military goods (link below), choose 3 items of one distinct topological family. The chosen items reveal their handling by the human body, the arm, the hand.
Duel_2: Isolate area of spatial effects
In Photoshop, isolate three specific moments (one of each item selected) that demonstrate the topological kinship of the three items.
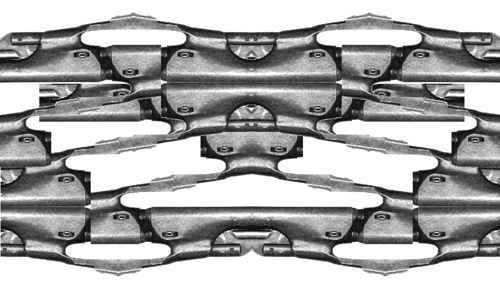
Duel_3: Let it run
Consider the three moments as mapping material for your selected rewriting system. Use simple operations, e.g. mirror, rotate, scale. Test many mapping rules (some use one moment, others use all), generate several fields. Run the system so that the isolated moments generate a continuous interlocking landscape.
What is Topology?
The Math Plug-In
ARMS etc.
 Erwin Hauer Erwin Hauer
 Erwin Hauer Erwin Hauer
 Math Math
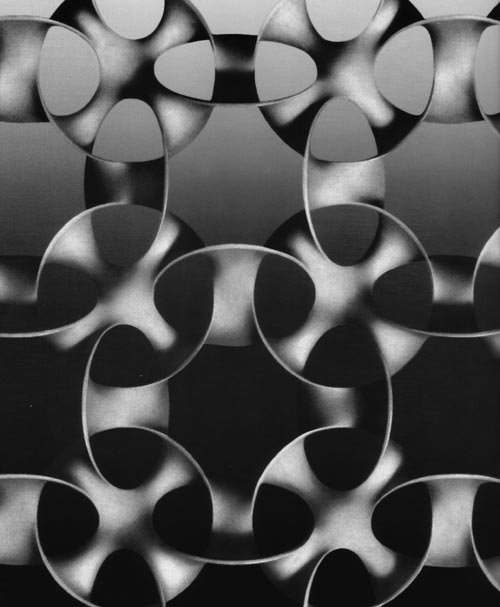 Erwin Hauer Erwin Hauer
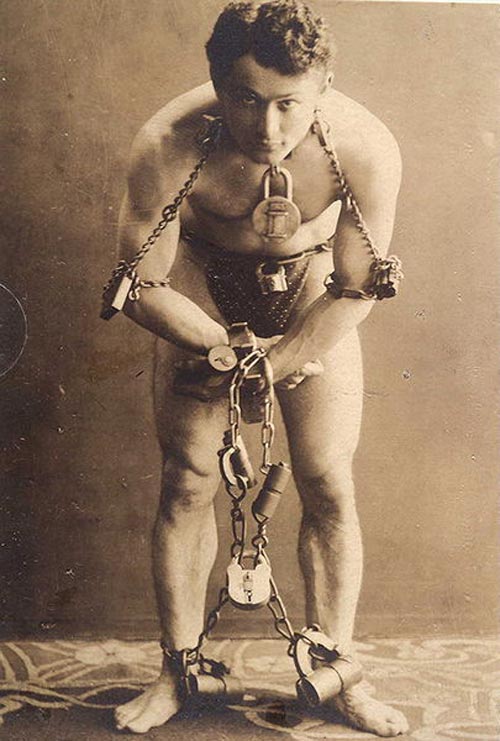 Harry Houdini Harry Houdini
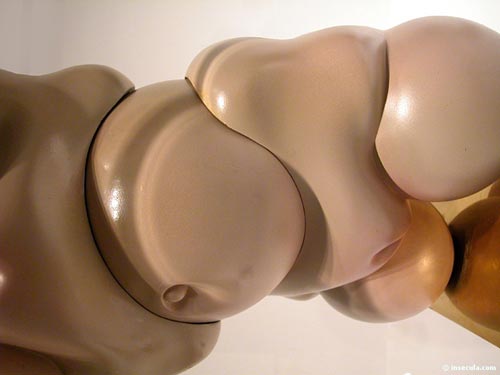 Hans Bellmer Hans Bellmer
 Evan Douglis Evan Douglis
.: Jonas 2:00 PM
20060920
Review One
.: Jonas 2:00 PM
20060918
Write
Develop the script for the global system. Test the script with your sparring partners. A script proper will allow a third party to re-run and re-create your assembly. "Let us calculate!"
.: Jonas 2:00 PM
20060915
.: Jonas 12:44 PM
.: Jonas 12:43 PM
20060914
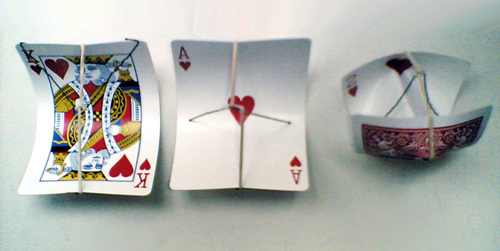
Build (C)
Build the new organism based on Generative Drawing 2. Use the given material (cards, clamps, rubber bands). Test moments of variation within the continuity of the system.
Draft a script for the global system including the applied Rewriting Rules, the Combinatory Logic derived from the biological model, and the Parameters based on the Material Properties.
.: Jonas 2:00 PM
20060913
Draw (C)
Draw a horizontal section of your sketch model. Informed by material properties, the new drawing describes an updated default system (compare 09/07: "Draw (B)"). Use line weight and -type to distinguish layers of information within the drawing.
Run axiom (A) through the system; i.e. apply a select rule set (A) through the updated default system (B) to generate a new state of greatest possible variation. Draw the updated field of deviation.
Overlay both states within one performative drawing. Draw beyond the paper space of 17" x 22" (wall paper). Use two distinctly different line weights within each layer to establish hierarchies
.: Jonas 2:00 PM
Library Course Reserve
Algorithmic Botany
L-sys4
AMNH : Lizard Show
WFC : Winter Garden
Artists Space
.: Jonas 1:18 PM
20060912
.: Jonas 1:06 PM
20060911
Build (B)
Explore the opportunities of the given building material to model the analyzed system (B). Use all materials as specified in the general syllabus: Poker cards, Paper clamps and Rubber bands. You may use a standard Single-Hole Punch; you may not use glue. Strictly comply with the given limitations as they strengthen the tectonic nature of your performance model.
The given materials come with a specific set of properties (resistance) that, when used to model a certain behavior, physically compute new assemblies. Identify and accentuate those changes that occur with the material application; they are valuable input for the emerging organism. Make notes of new parameters.
.: Jonas 7:19 AM
20060910

.: Jonas 9:01 PM
20060907
Draw (B)
A drafted autopsy reveals the workings of a found creature. In a series of drawings, conduct a geometric and morphological study of the biological assembly. Identify a combinatory language that defines the role of the part to the whole, cell to lattice. What are the systems main behaviors and how are they formalized. Be opportunistic in using your resources.
Construct from your research material, do not trace. Parts of your study work towards a detailed understanding of the individual unit; the main focus however is on the relationship that this unit establishes with its neighbors and the global system that emerges from these relationships. Define the corridors of change within the system (in geometric terms). Draw a default state of continuity as well a state of greatest possible variation within the intact system. Overlay both within one generative drawing. Use two distinctly different line weights within each layer to establish hierarchies.
Test (Material)
A series of very simple sketch models tests the properties of the given building material. Only few (2-4) elements are used to establish a sense for the material.
.: Jonas 11:32 AM
20060906
Intro to the Machine
We start with two parallel investigations, one of computational logic and one of living form. A simple rewriting exercise (A) introduces the concept of rule-based systems; a found creature analysis (B) reveals an organizational and formal logic.
From the possible formations of a found creature we extract raw material for a synthetic process. We feed the abstract system (A) with the result of our analysis (B) and breed a new organism, a synthesized system of behaviors (C).Run (A)
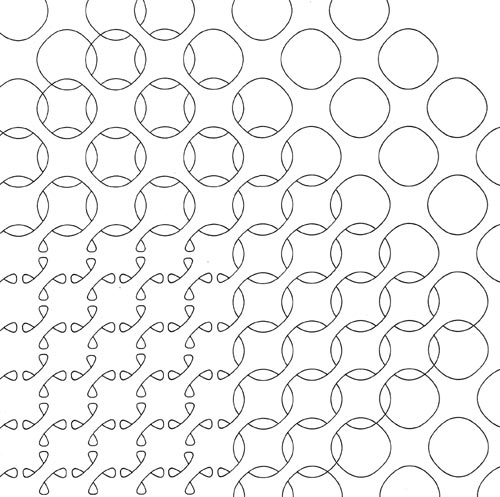
Define a simple rule set (axiom) for a Rewriting System. The axiom consists of only three to four characters. Let the system run for nine generations, starting with a seed of only one character. Apply all rules of the set in parallel for each generation. (see example)
A pattern emerges from your first axiom. Write several axioms and develop simple mapping rules (2D and 3D) that help visualize and compare the patterns. Possible mapping rules interpret abstract string information as spatial information.
Do not change a rule set while the system is running. Let it run for a set number of generations, map the strings, then evaluate and improve the rules for a new axiom. Test many axioms and develop a set of criteria to evaluate the results. Consider meta rules. Select three rule sets to be put in studio wide format. Contribute those to the Pool.
Research (B)
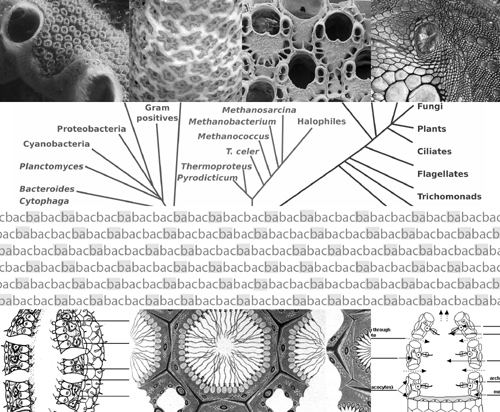
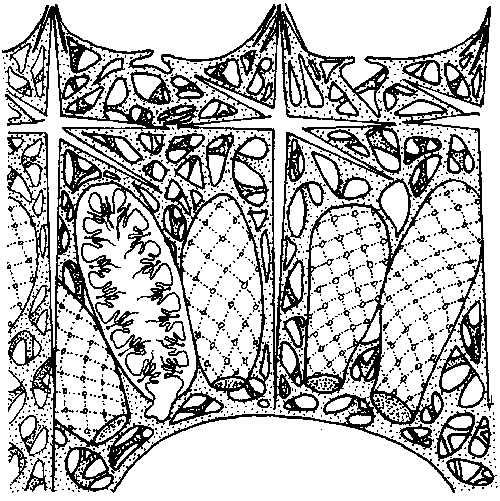
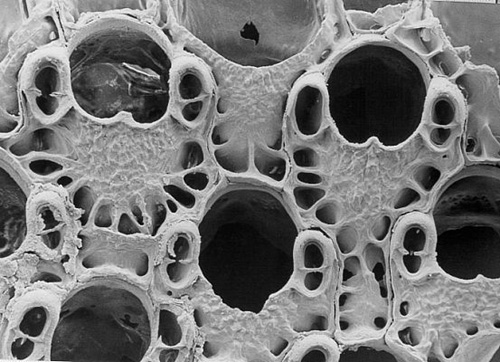
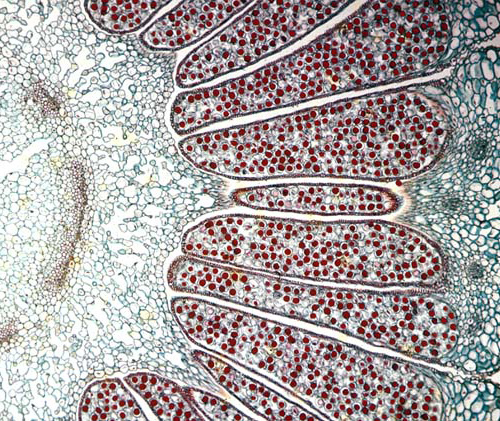
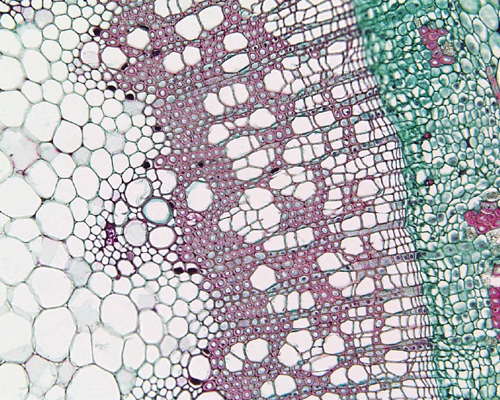
Select a creature from the given list of found images. Identify and classify the creature by naming it according to standard taxonomy. Collect material (text and visuals) for a deep research of the organism’s structure system (formal) and its behavior (performative).
The material for the formal analysis (diagrams, illustrations, photos), addresses organizational and geometric parameters. For the performance analysis consider internal criteria such as food processing (passive-active, input-output), and external ones such as social and climatological environment. Limit your research to few traits, be very specific.
.: Jonas 9:55 AM
20060905


.: Jonas 10:52 AM
|
